

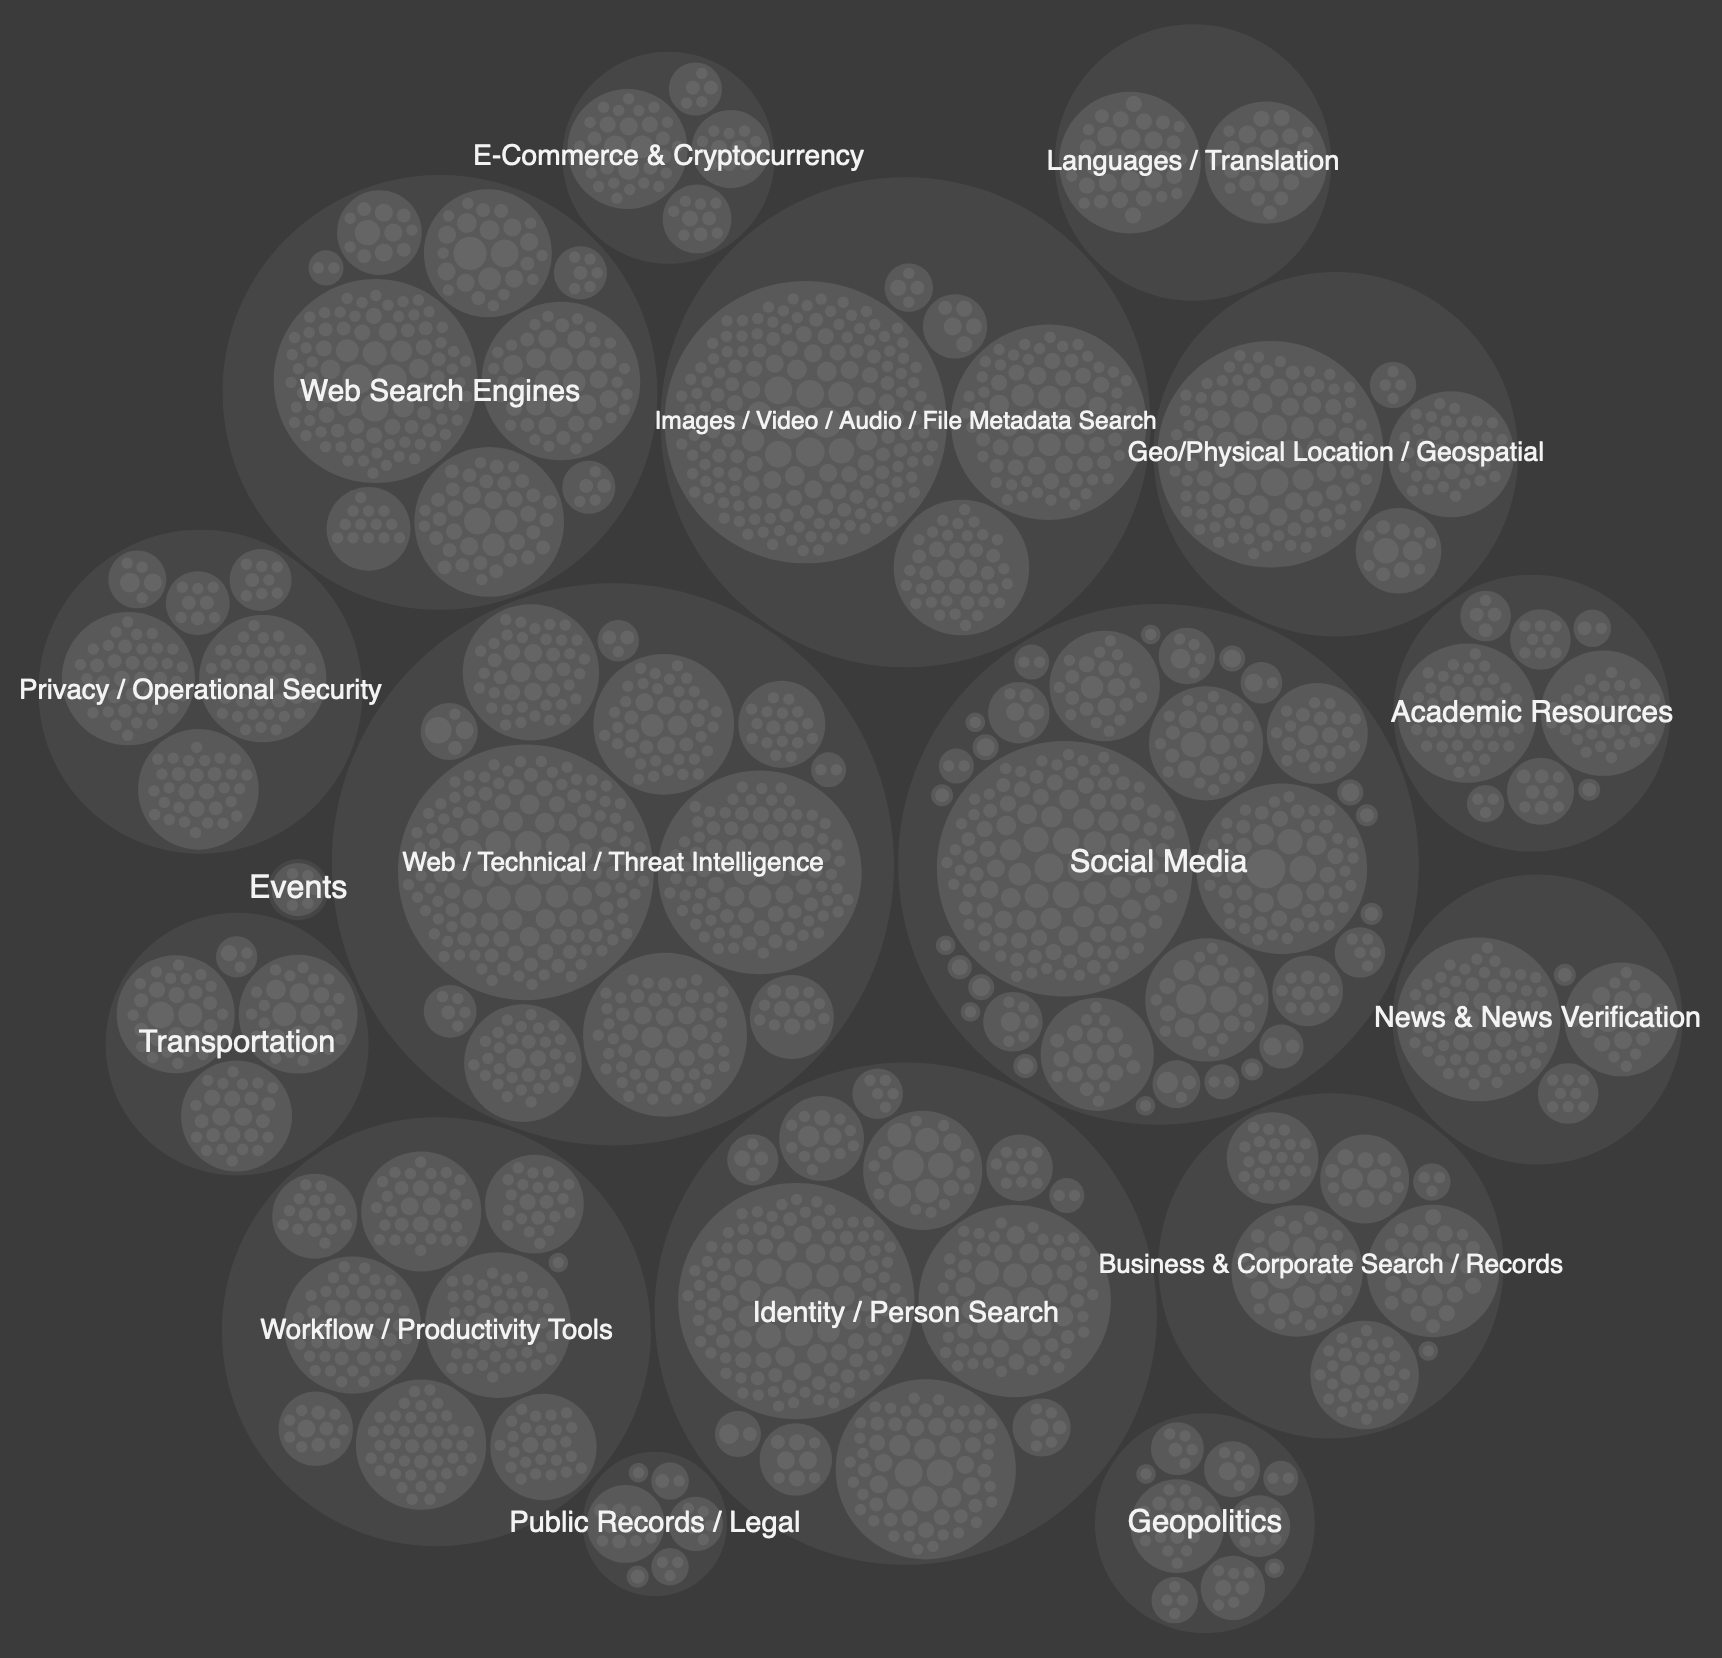
An interactive visualization of 8k OSINT tools & resources, scaled according to relative citation popularity
Below are some of my favorite visualizations I've had a chance to share. Most images link to a supporting source that provides further context.
An interactive visualization of 8k OSINT tools & resources, scaled according to relative citation popularity
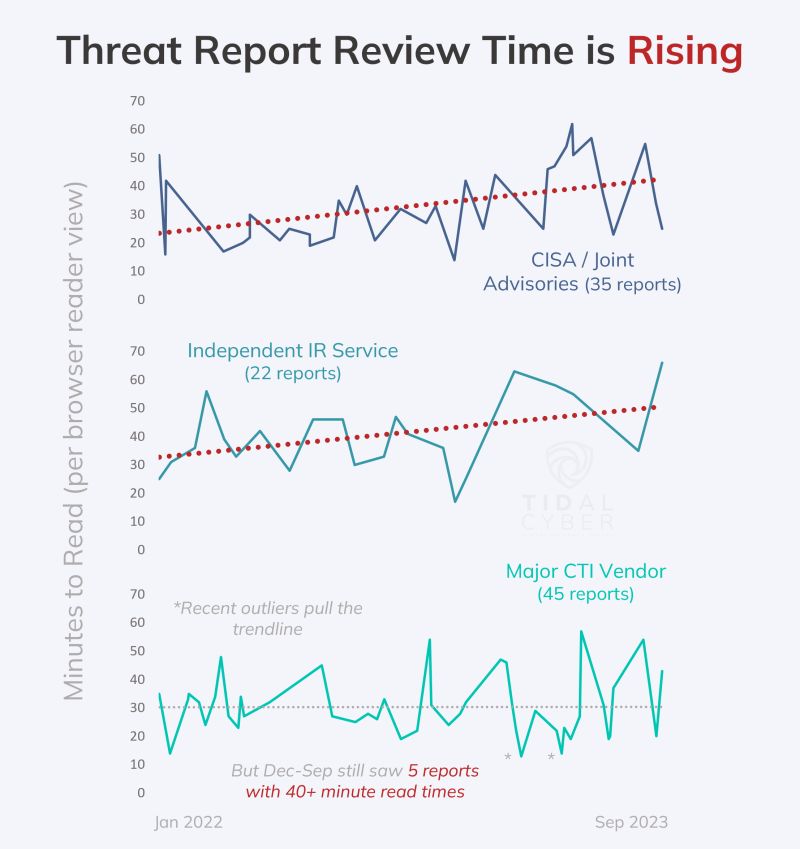
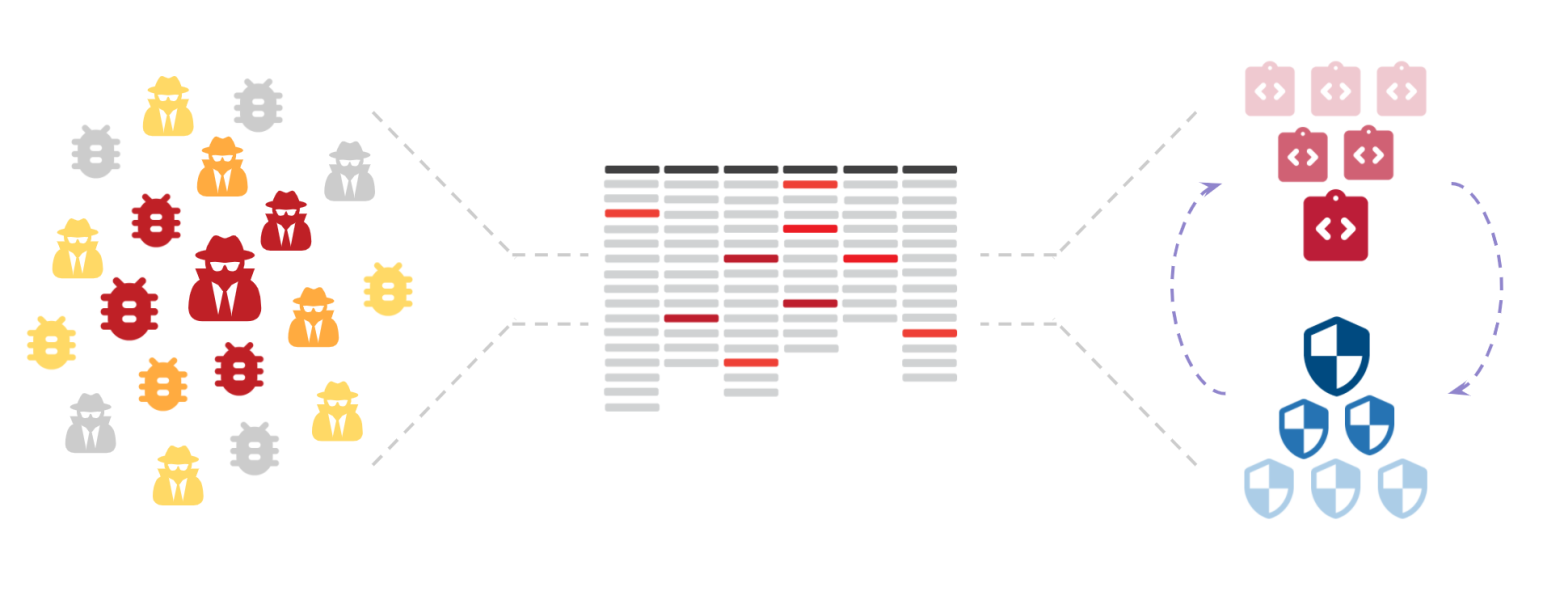
Many CTI reports contain increasing amounts of detail, but this often adds time & effort to the review & processing phases
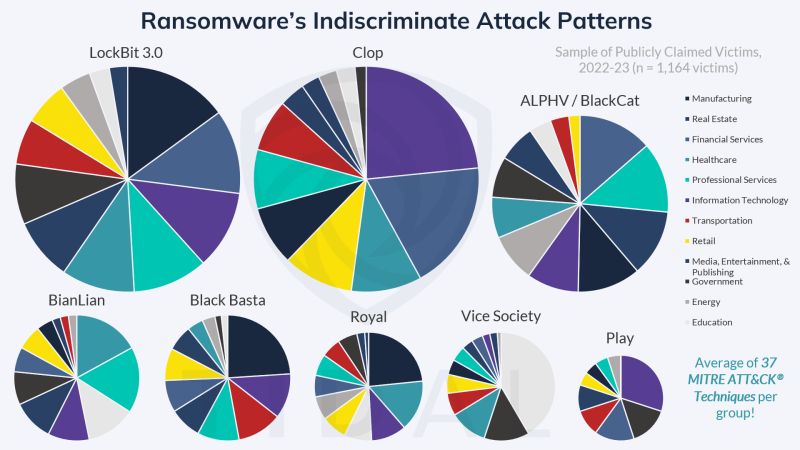
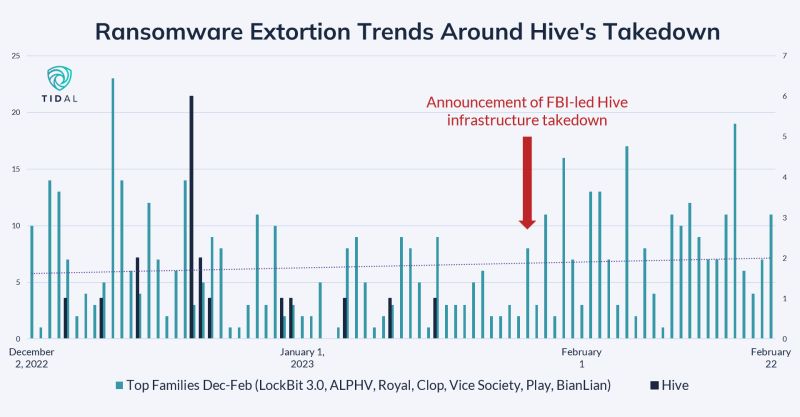
Top ransomware operations often attack indiscriminately, making prioritization a challenge
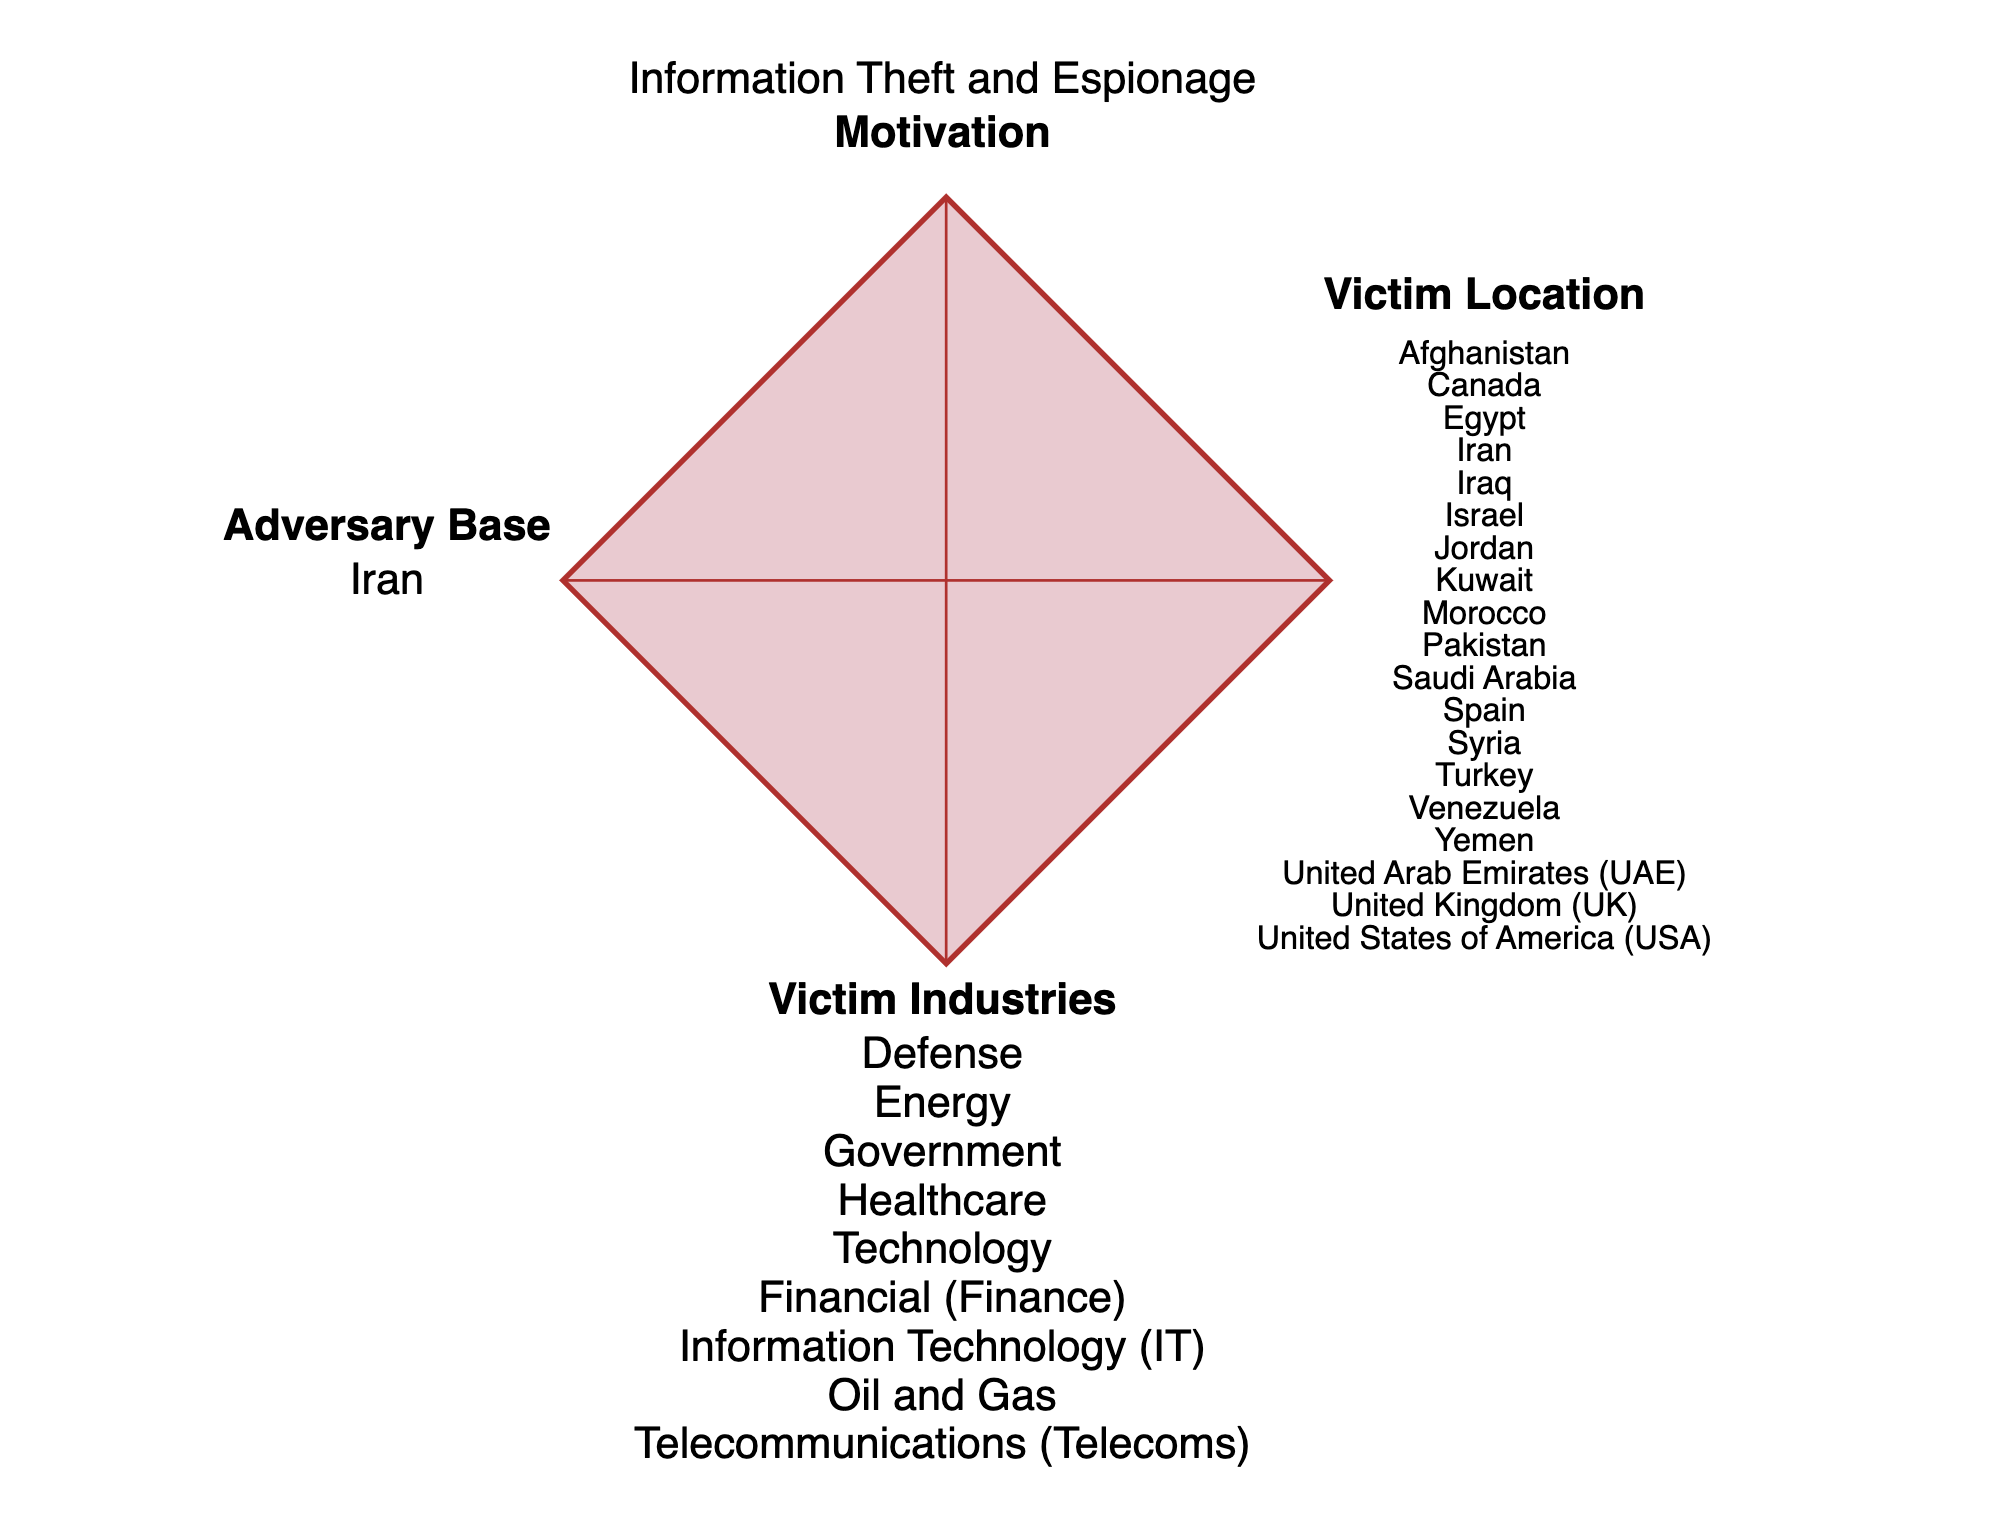
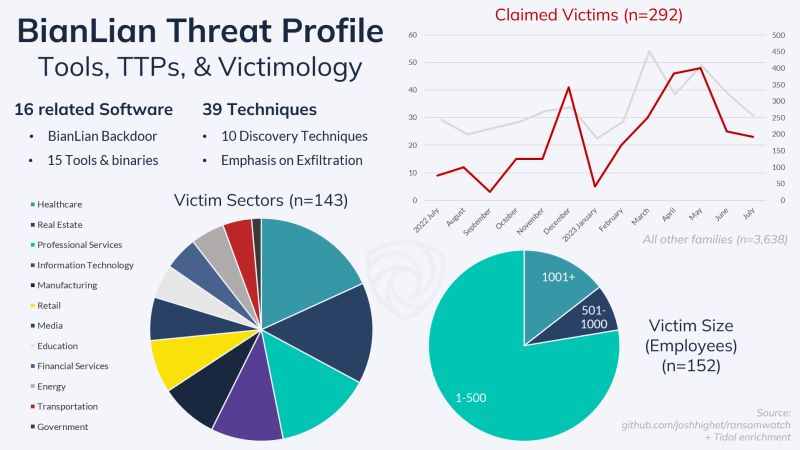
An auto-generated series of Diamond Model-esque visuals summarizing key characteristics of major cyber adversary groups & their common targets
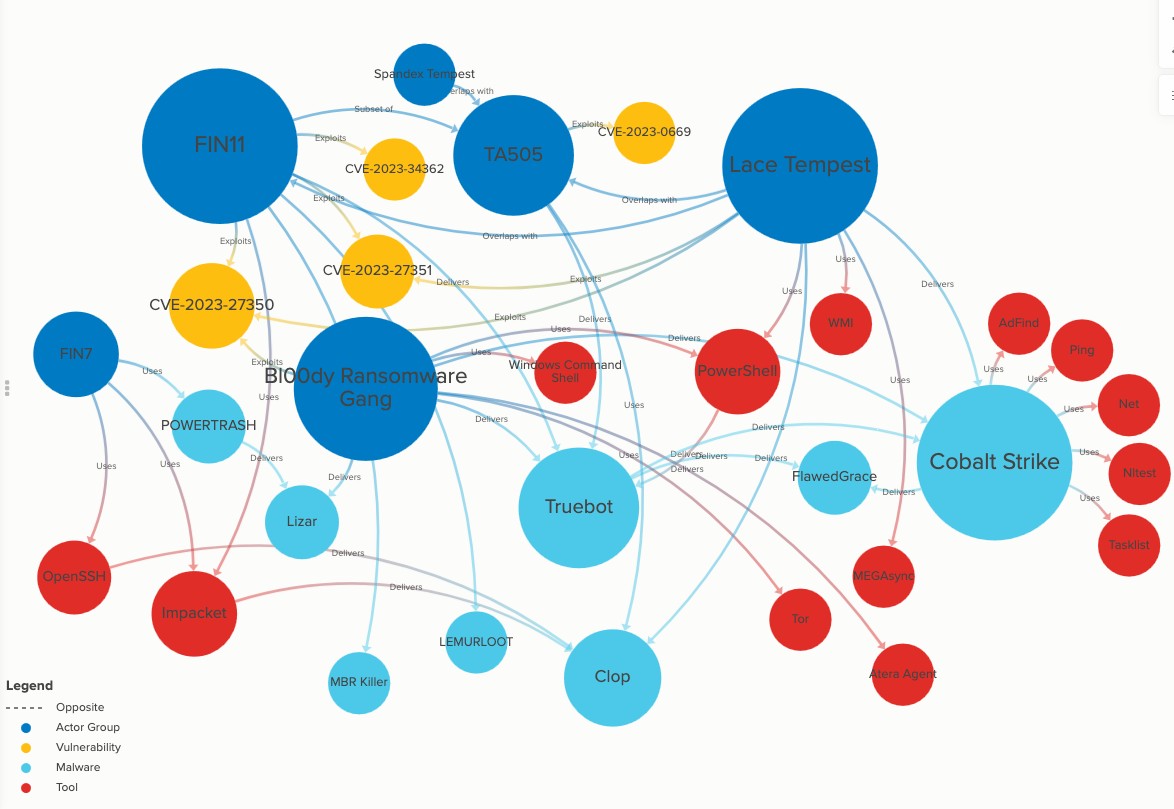
An interactive link analysis of the tools & TTPs associated with the Clop ransomware operation
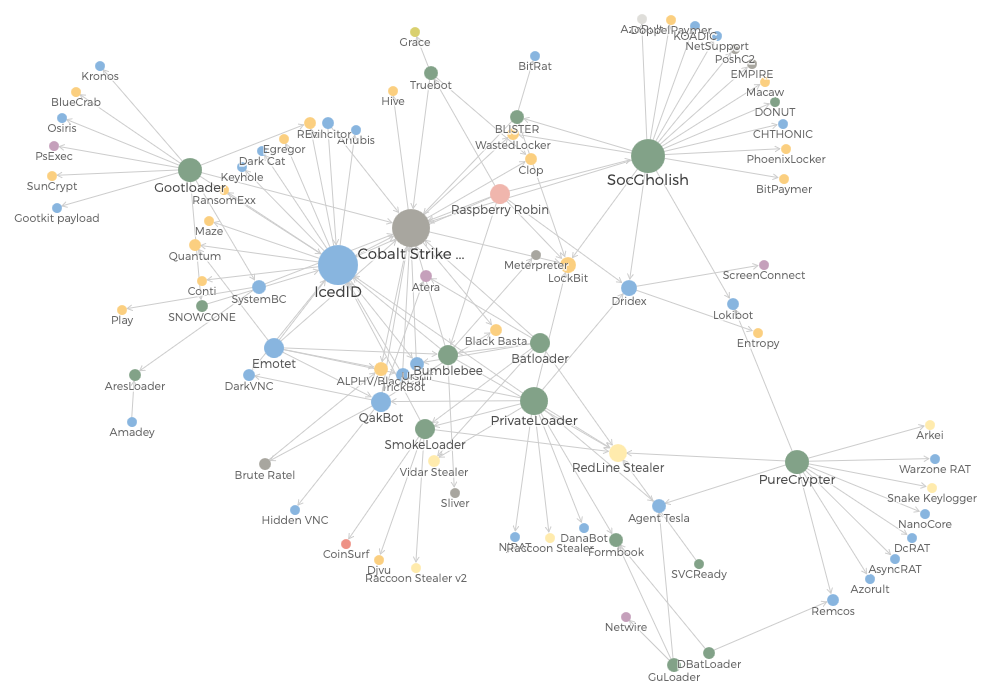
An interactive visualization showing relationships among various malware/tools used for initial network access (see the accompanying talk here!)
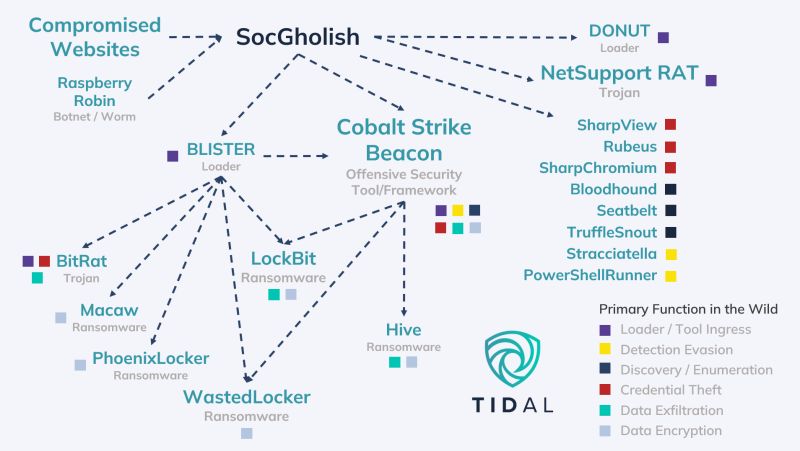
SocGholish malware's links to adversary operations & other attacker tools
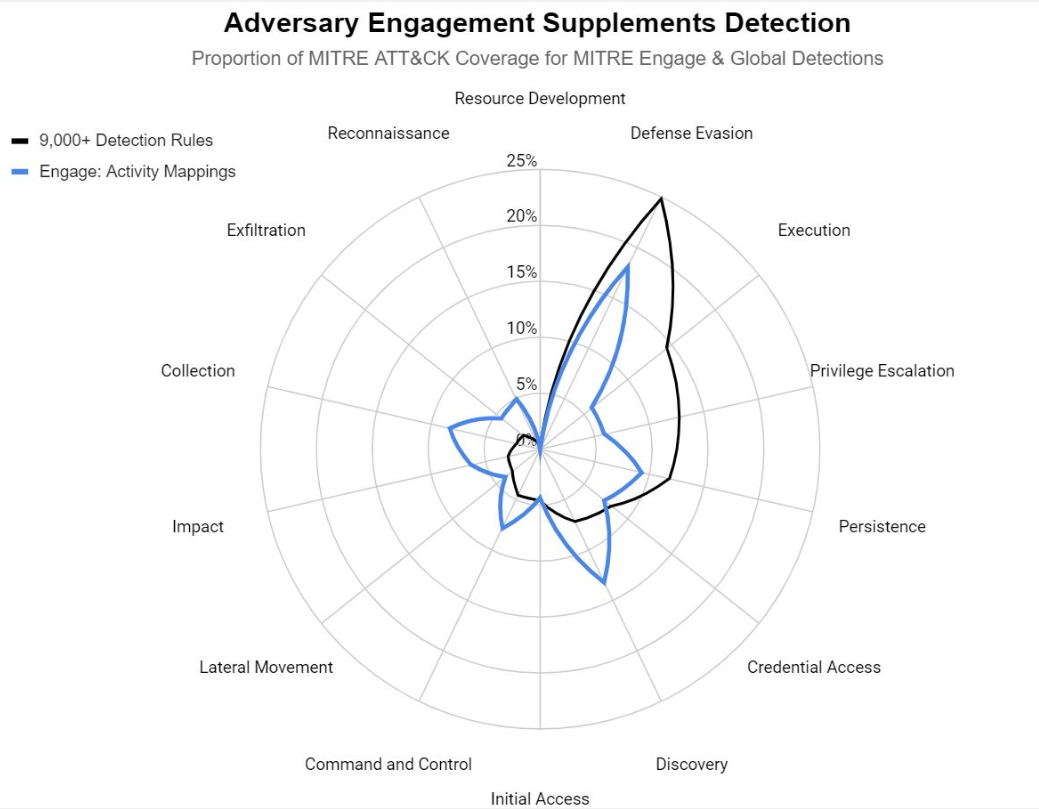
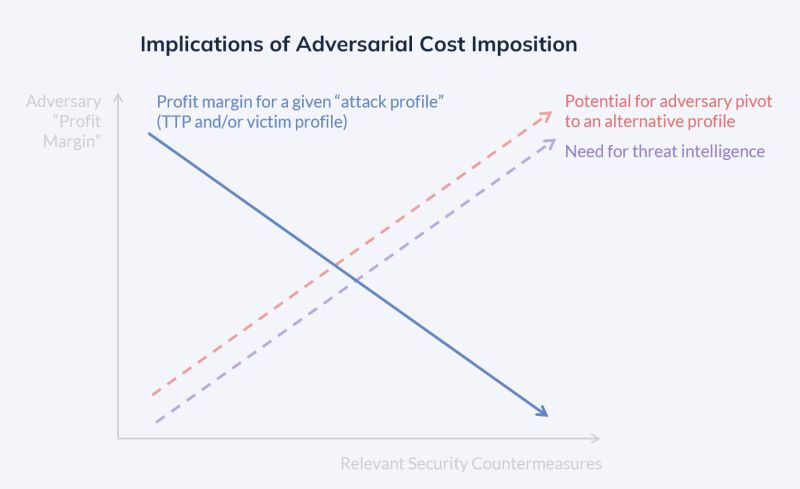
Informing red team testing with risk profiling, MITRE ATT&CK®, and TTP intelligence leads to quicker identification & closing of security gaps
Security control alignment with TTPs and the key steps of a control validation process
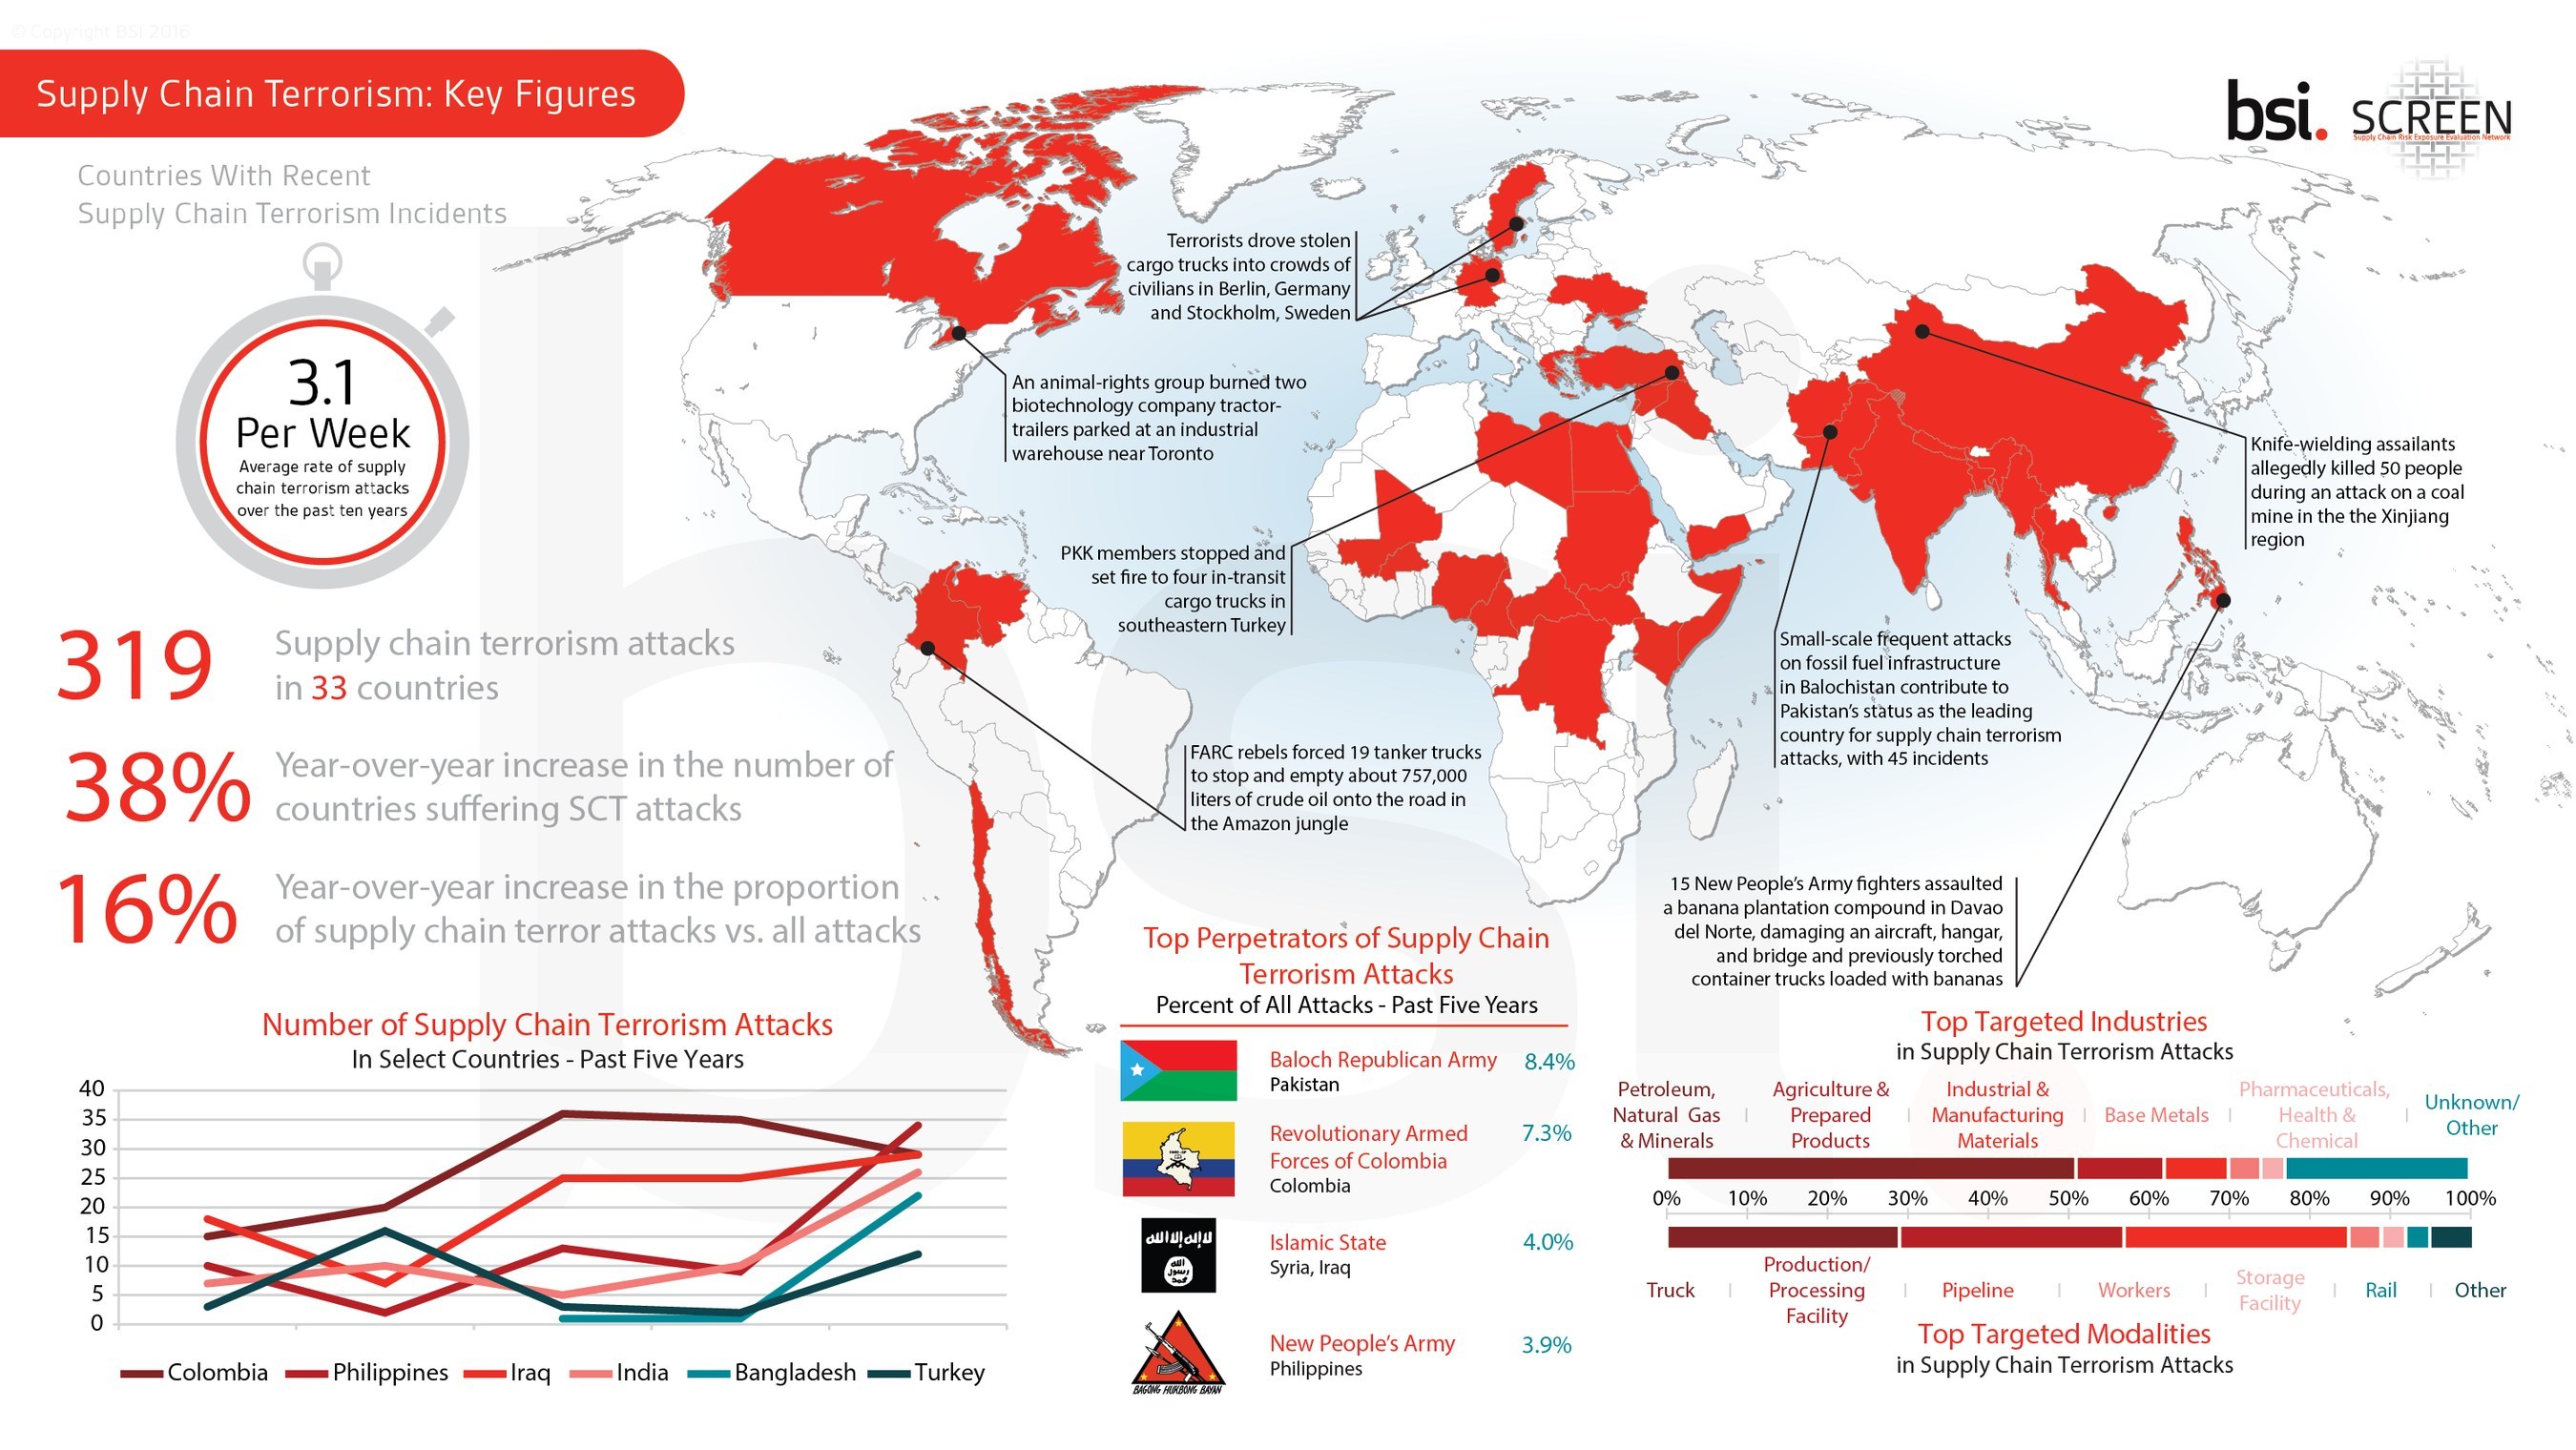
Led development of an original, data-driven study on "supply chain terrorism" and its impact on global trade
Cyber Threat Intelligence Capability Maturity Model (CTI-CMM): A primary author of the cornerstone "Threat" section of this community-driven CTI maturity framework
The Ultimate Guide to Cyber Threat Profiling: Authored all of the content in this 60-page guide designed for threat intelligence analysts and other security practitioners
Defensive Measures Against Ransomware: Collaborative study with the Global Cyber Alliance, focused on practical risk reduction measures for small- & medium-sized organizations (and enterprises)
Election Cyber Interference: Threats & Defenses: Sole researcher & author behind this 38-page, data-driven study
Tidal Cyber's blog: Lead contributor of the company's web content, regularly publishing CTI- and data-focused analysis
Axios: Hackers expected to double down on trusted tactics in 2024
DarkReading: Deepfake Democracy: AI Technology Complicates Election Security, Iran-Israel Cyber War Goes Global, Redesigning the Network to Fend Off Living-Off-the-Land Tactics
The Register: Akira: Perhaps the next big thing in ransomware
BankInfoSecurity: Sizing Up the Worst Healthcare Hacks of 2023, As Elections Loom, So Do Adversaries' Influence Operations, Hackers Hit Medical Imaging Services Centers in NY, Texas
NextGov: AI escalates election cyber threats with the US as prime target, reports find
Help Net Security: Cyber threats cast shadow over 2024 elections
Infosecurity Magazine: US, UK and India Among the Countries Most At Risk of Election Cyber Interference
InformationWeek: Iranian Threat Actors Ramp Up Ransomware, Cyber Activity
Activity-Attack Graphs for Intelligence-Informed Threat COA Development: Data from my Categorized Adversary TTPs project was cited & used in a study conducted by researchers at the U.S. Military Academy at West Point
MetaOSINT project mentioned in the following publications: The OSINT Newsletter Issue #35 & Issue #38, Week in OSINT, OSINT Jobs Weekly OSINT Newsletter
Invited to present & train at numerous conferences & events (see more on the Talks page)